


Continuing the Conversation: An Annual Update
Last year, we shared our reflections on Better Society Capital’s 2022 Enterprise Level Data, exploring how Access-funded programmes were delivering on our mission to expand access to social investment. This year, with the release of the 2023 data, we’re revisiting those insights to track progress and uncover new trends in social investment.
At Access, we continue to focus on using blended finance to create opportunities for charities and social enterprises that are excluded from traditional funding markets. By combining grant funding with repayable finance, we make social investment deals viable for organisations that would otherwise struggle to access this type of funding.
The annual Enterprise Level Data, published by Better Society Capital, provides an essential opportunity to understand how our approach is working. The data includes information from social investors and intermediaries about organisations that have accessed social investment across the UK (Enterprise Level Data is UK wide, while Access data is only from England. This is because the Access mandate only covers work in England). Analysing this alongside data from our own programmes enables us to understand whether our grant is helping expand access to social investment through blended finance.
To support this year’s analysis, we have updated our dashboard. The dashboard presents key data in an accessible and interactive way, allowing users to explore trends over time, compare Access and non-Access investments, and examine the reach of investments into more deprived areas.
You can explore this data further in this dashboard (we’d recommend opening it in a new tab to get the full experience).
Small but Mighty: Continuing the Trend
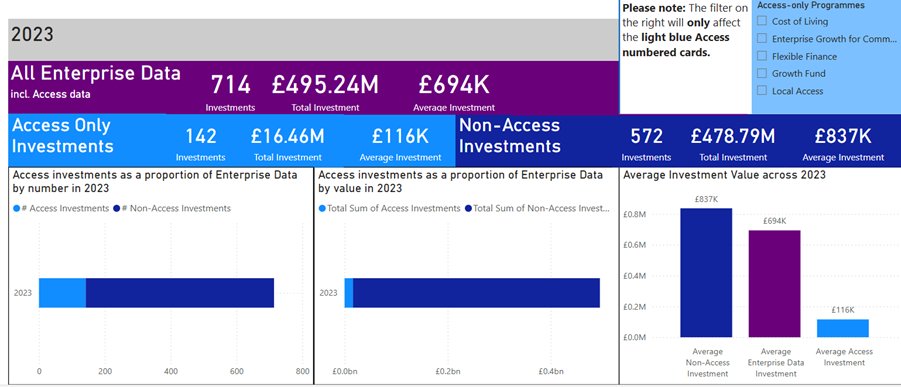
As in 2022, Access programmes continue to support a larger volume of smaller deals compared to the wider market. The 2023 data shows that the average investment size for Access-funded deals was £116k, compared to £837k for non-Access investments (slide one). This is important because the average social enterprise is looking for investment of around £80k (SEUK, 2023).
Our average investment size is slightly larger than last year (£81.5k) and this can be explained by the fact that Flexible Finance deployed £10.29m of the total £16.46m deployed in 2023, and had an average investment size of £166k. Flexible Finance is specifically designed to deploy patient and flexible social investment, rather than specifically aiming to provide smaller scale investment deals. To dig more into the data on Flexible Finance (and our other programmes), have a look at our quarterly dashboard.
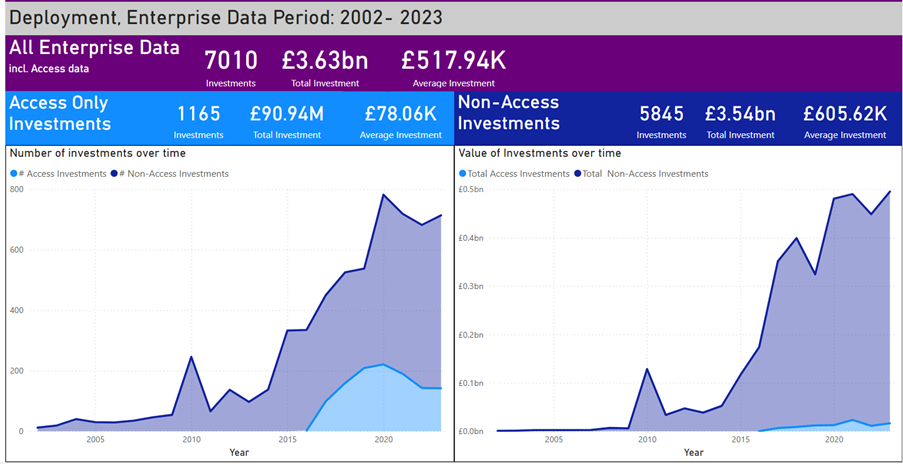
You can also look at the data trends over time in slide 4, with the two graphs emphasising Access’ role in delivering a large number of small deals since the launch of our first programme in 2016.
Reaching Communities in Need
The 2023 data reaffirms our commitment to supporting organisations in the most deprived areas of England. A significant proportion of Access investments were directed to the 30% most deprived areas, with 58% targeting these communities. This is in comparison to the rest of the Enterprise Data, of which 33% targeted the 30% most deprived areas.
Blended finance continues to play a critical role in enabling these organisations to access funding. Without this approach, many would remain reliant on grants or other unsustainable funding models.

Learning and Growing: Using the Data
This annual update reflects our ongoing commitment to assessing and improving the impact of Access programmes. The insights from the 2023 Enterprise Level Data and accompanying dashboard help us track trends, evaluate our progress, and refine our strategy. The data confirms that, through our partners, we are continuing to reach smaller organisations in more deprived communities who would otherwise not be able to access social investment.
Looking ahead, as more data becomes available, we will be able to carry out even deeper analysis. This will allow us to ensure that blended finance continues to play a transformative role in addressing gaps in the social investment market.
Methodology Notes
- As with last year’s data multi-tranche investments within The Growth Fund have been consolidated into single data points for clarity.
- Data completeness varies, particularly regarding postcode information, which affects the analysis of deprivation data on slide two. Better Society Capital and Access also use different methodologies for calculating IMD (given BSC work across the UK and Access only work in England), and this means you may see differences between the IMD data captured in our dashboards and that on the BSC website.
- 43% of the non-Access investments did not have postcode data, and therefore have been ommitted from the IMD calculations. This means that the 32.8% figure stated above (% in IMD 1-3) is 32% of the investments that had postcode data. All Access investments had postcode data and therefore have been included in the IMD comparison above.
- In slides 1-3 it is worth noting that if BSC have increased their number of contributors to Deal Level Data over the years (and if new contributors have not all reported their earlier data as well as new investments) then some of the trends in the wider dataset – and therefore how this compares to Access data – may be partially attributable to those changes.
- When discussing the size of Flexible Finance investments above, it’s worth noting that there are also a couple of other factors at play here, including inflation between 2022 and 2023, and Flexible Finance often targeting larger asset projects, which can skew the average (mean).