Big Society Capital recently published their Deal Level Data (DLD) and their broader Market Data to December 2020.
This data contains a wealth of information about the social investment market and how it is changing over time. At Access, one aspect that we are always particularly interested in is how the Growth Fund (managed by us, funded primarily by The National Lottery Community Fund and Big Society Capital and delivered by our social investor partners) compares to the wider market.
BSC’s Market Data estimates that across the whole social impact investment market “£1.2bn was committed to charities and social enterprises in 2020, representing 1,152 transactions”. This suggests an average commitment size of over £1m during that 12 month period.
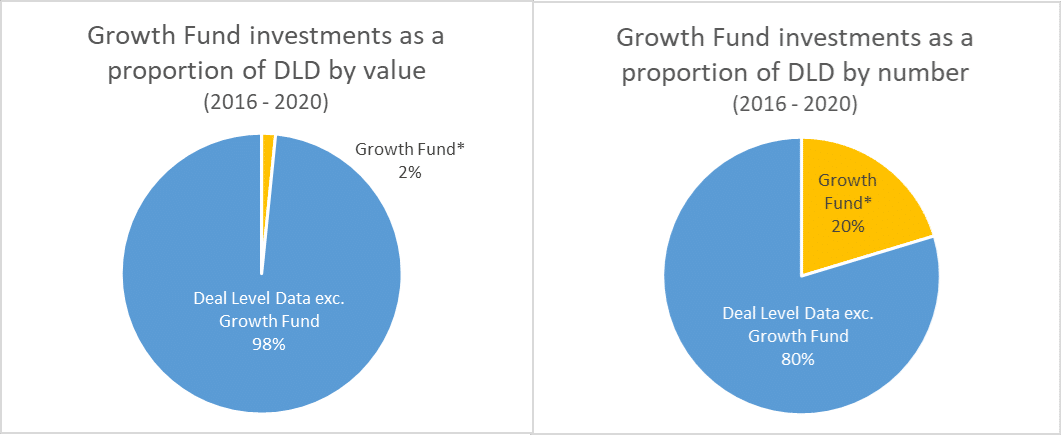
The more detailed Deal Level Data (which now goes back up to 18 years) shows £2.9bn worth of investment to date, with an average commitment size of £580k and a median of £75k. When the Growth Fund is excluded from that dataset the average investment size rises to £659k with a median of £100k. With Growth Fund lending representing only 1.18% of the total DLD dataset by value, the impact that the programme is having on those overall averages is significant.
From its launch in 2016 up to the end of 2020 the Growth Fund had an average investment size of £66k* with a median of £50k* (across £34m of investment). By comparison, the £2.1bn of non-Growth Fund investments in the Deal Level Data during that same five year period had an average investment size of £1.088m and a median size of £250k.
Overall investment sizes fell during the first year of the pandemic compared to the four years prior.
Between 2016 and 2019, non-Growth Fund deals in the DLD averaged £1.2m with a median of £250k. In 2020 this fell to a £714k average with a median of £205k.
Between the same two periods Growth Fund investments also fell, from a £68k* average/ £52k* median across 2016-19 to a £58k* average/ £50k* median during 2020.
During 2020 there were 87* Growth Fund investments compared with 504 non-Growth Fund deals.
Between 2016 and 2020 there were 2,027 investments reported in the Deal Level data, totalling £2.1bn. During that same period there were 517* Growth Fund investments totalling £34m. This suggests that the Growth Fund, although small, is meeting the needs of a large number of charities and social enterprises.
*Notes on data and methodology
Inevitably when incorporating a programme such as the Growth Fund into a larger dataset of this scale there are nuances and caveats which may not be automatically apparent from the dataset itself, so it is worth touching on some of those here.
The majority of Deal Level Data is reported using ‘initial commitment date’. We might assume that, in most cases, deployment will follow shortly after. However when incorporating Growth Fund data into the DLD, Access and BSC use deployment date in this field instead. This is to ensure that we only include data for investments that do actually go on to be deployed. (Due to the nature of the Growth Fund – which provides small ≤£150k, unsecured blended investments to generally small and often first-time borrowers – applicants often change their mind or wait a long time between receiving an offer and taking on the investment).
Other than timing, the main impact that this method of reporting has is in terms of how multi-tranche investments are recorded. A Growth Fund investment that was drawn in two tranches – thus having two different deployment dates – effectively appears in the DLD as two separate deals. In the broader DLD dataset however, it is our understanding that multi-tranche deals generally have a single ‘commitment date’ and thus are being reported in most cases as a single deal.
When Access analyses Growth Fund data outside of the DLD we combine multi-tranche investments into one, to ensure that our averages are based on number of investments rather than number of tranches. Therefore our methodology for calculating the ‘Growth Fund only’ averages in this blog differs in this way. (Had we calculated averages based on the individual tranches, the Growth Fund averages/ medians would be even smaller.) The resulting figures are marked with an ‘*’.
Furthermore, many Growth Fund investments include a portion of direct grant provided to the investee alongside the blended loan. These grants are usually deployed at the same time as the loan and thus form part of the same tranche. During the pandemic however, Growth Fund social investors were permitted to deploy additional tranches of emergency Growth Fund grant to pre-existing investees in order to provide additional support to those organisations most in need. These additional grants effectively become a subsequent tranche of a previous investment. In the DLD these grant-only payments appear as individual tranches, but in Access’s Growth Fund calculations we have included them as part of that charity/ social enterprises’ overall investment.
When calculating Growth Fund-only averages for 2020, we have considered an investment to have been made within that year if the first tranche of the investment had been deployed during 2020. This avoids the inclusion of older investments where only a subsequent emergency grant tranche was deployed during 2020.
If you would like to know more about the Growth Fund data or our methodologies for analysing it do get in touch.


