
News
Our data - How do we know we’re expanding the reach of social investment?
Following the publication of Big Society Capital’s 2022 Enterprise Level Data, Lydia Levy reflects on what it tells us about the organisations funded by Access programmes, why they are different and why this matters.
- Blog
- Market development
Designed to disrupt the social investment market, we focus on increasing the number of charities and social enterprises that can access social investment.
One of the key tools we use for this is blended finance, where grant is blended with repayable finance in various ways to make a social investment deal viable. This means that we’re particularly interested in understanding how the organisations receiving blended finance from us via our partners are different to those receiving non-subsidised investments. Given our mandate, we would expect those organisations to have some different characteristics to the broader social investment market.
One way we can understand this is by comparing our data with what Big Society Capital (the UK social investment wholesaler) publishes annually. They recently published their 2022 Enterprise Level Data (previously known as Deal Level Data), which includes data from social investors and intermediaries about charities and social enterprises who have taken on social investment during 2022 and the preceding years.
The Enterprise Level Data includes data on the blended finance investments we fund which are delivered by our partners1, and we’ve done some further analysis to better understand the differences between the programmes we deliver in England through our partners and the wider UK social investment sector. This analysis builds on work we’ve done with this data in previous years, with the most recent one in 2021 for the 2020 data.
You can explore this data further in this dashboard (we’d recommend opening it in a new tab to get the full experience).
The dashboard is interactive, and this means you can dig into whichever part of the data you’re most interested in. You can select specific Access programmes, or look at a specific time. In our analysis, we chose to focus on three main aspects: the number of investments, the total sum of investments and the average investment size. The dashboard also looks at where the work funded by Access and Big Society Capital have reached by the Index of Multiple Deprivation (IMD) respectively.
Small but Mighty
How blended finance enables investments 10X smaller than the rest of the social investment market
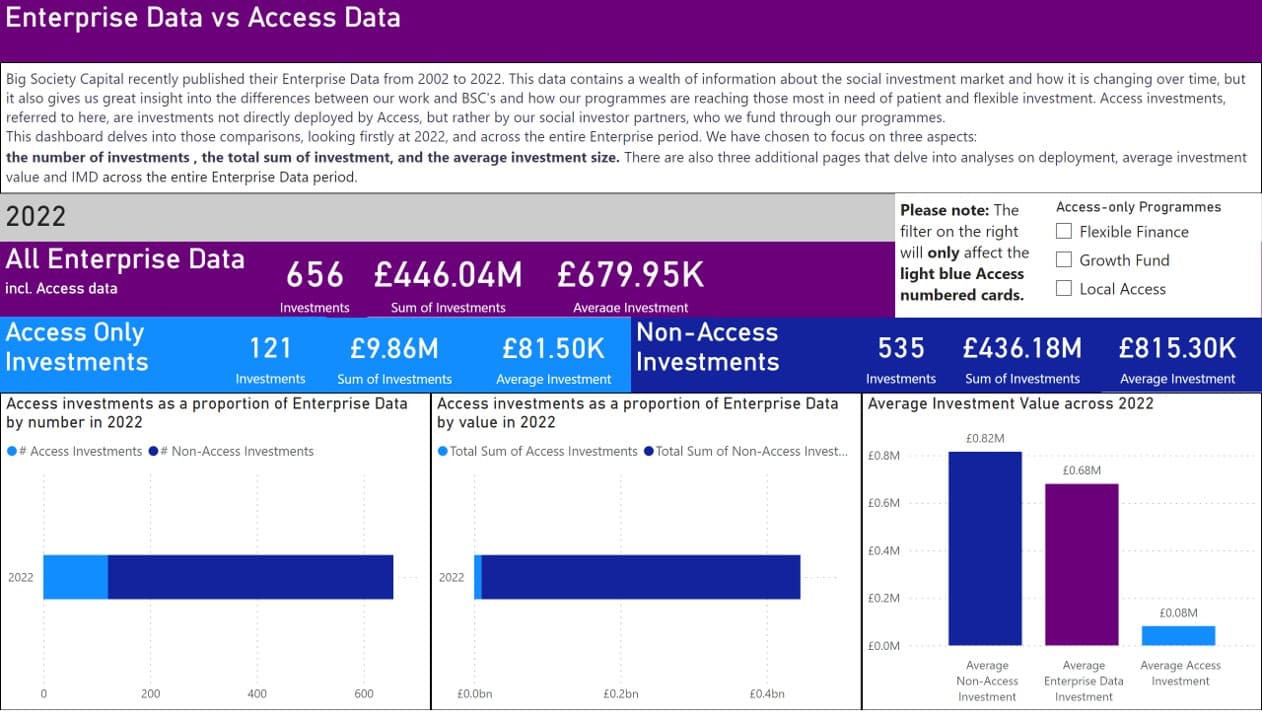 The first slide of the dashboard looks specifically at 2022, and you can see that Access blended finance programmes, as delivered by our social investment partners, have an average investment size of £81.5k, compared to the average investment size of £815,300 for Non-Access Investments.
The dashboard also offers the opportunity to filter by Access programme. The Growth Fund is a partnership between The National Lottery Community Fund and Big Society Capital, delivered by Access through a range of social investors. It made up to £50m available to support charities and social enterprises to grow and create social impact in their communities. The Growth Fund used a combination of grant funding, made possible thanks to National Lottery players, and loan finance from Big Society Capital and other co-investors, to address specific gaps in the social investment market. It is our longest-running programme and has the largest number of investments (94 in 2022 alone), despite it being close to its end in 2022 after five years.2
Transforming the landscape
How blended finance delivers for charities and social enterprises through a large number of small deals
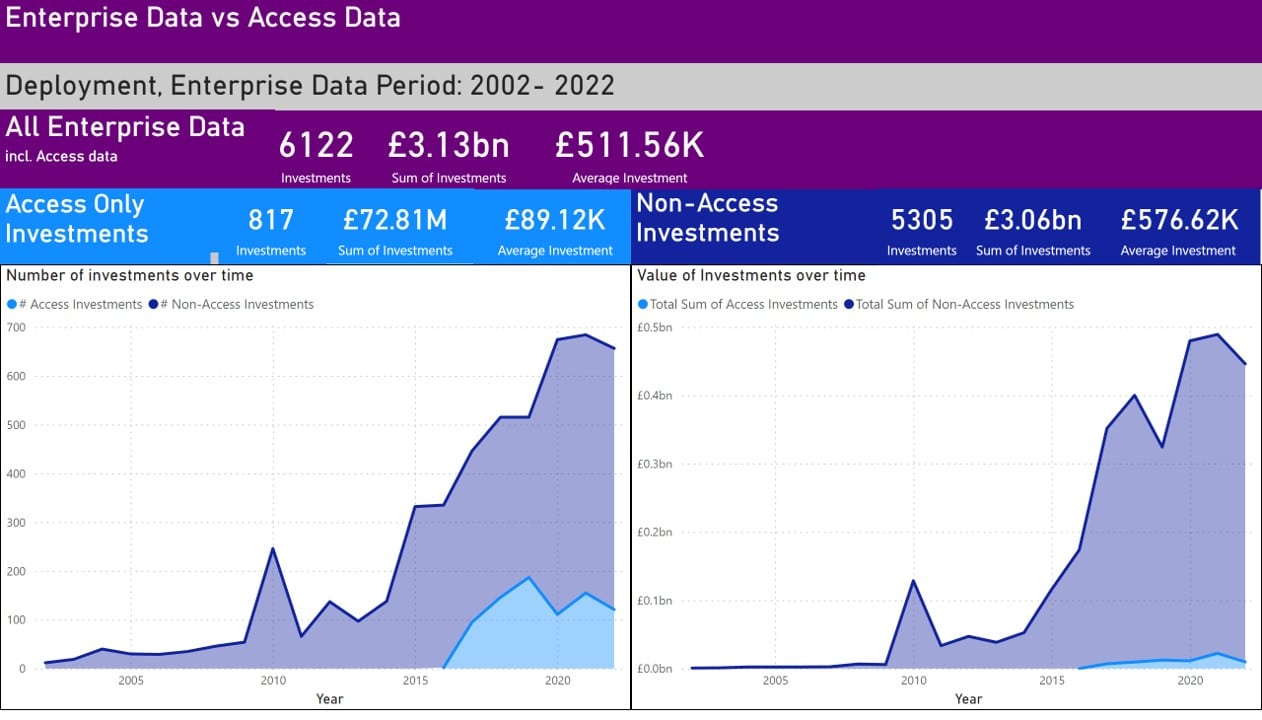 Slides three to five allow you to compare general Enterprise Level Data and Non-Access Investments with Access investments over time in several ways. One of the most significant comparisons that the dashboard highlights is on slide four, where you can compare the average number of Access and non-Access investments over time to their value in the same period. While Access investments make up a tiny amount of the total value (as you can see on the right-hand side of the slide), they make up a much larger proportion of the total number of deals. This is another demonstration of the fact that Access has succeeded in our mission of delivering a large number of small deals in our lifetime.
We know that smaller deals are key to bringing new organisations into the social investment market, as the average social enterprise or charity is looking for deals of £80,000,3 while the Enterprise Level Data tells us that the average (mean) non-Access social investment deal in 2022 was £815.30k. This shows that blended finance is a key tool in meeting the needs of social enterprises and charities, particularly smaller organisations or those based in more deprived areas.
Shifting the focus
How blended finance deals are more targeted at areas of high deprivation with more than 50% of our investments in the 30% most deprived areas of England
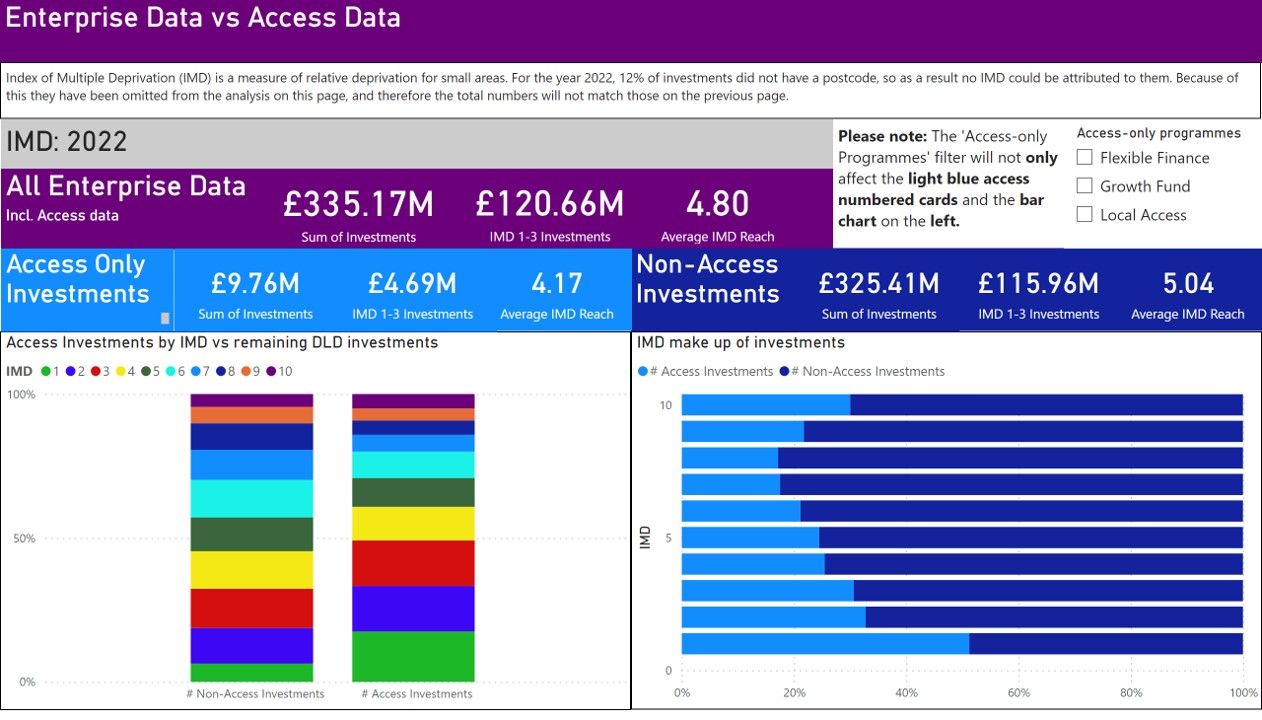 The second slide of the dashboard looks at differences in the dataset around the levels of deprivation (using the Index of Multiple Deprivation) in the areas that Access programmes have invested in, in comparison to all Enterprise Data and Non-Access Data. As explained above, Access and our partners use blended finance to make deals possible that otherwise would not be, therefore reaching organisations who might otherwise be fully reliant on grants and fundraising. As an organisation, we also aim for 50% of our funding to enable blended finance deals for charities and social enterprises in the 30% most deprived parts of the country. Therefore, it is unsurprising, and heartening, to see from the IMD comparison data on the dashboard that we have achieved that goal, and that in 2022, 20% more of our investments went to IMD 1-3 than those from the rest of the market.
How will we use this data in future?
This dashboard allows us to dig into the differences between Access’ work, and the wider social investment sector. We can see the role that blended finance is playing in a larger number of smaller investments to the charities and social enterprises who need them, and verify if we are achieving our aims of reaching organisations in the most deprived parts of the country. We can track trends over time, and also compare across our programmes. As time passes we will have more blended finance data from our partners and the analysis will be richer and deeper.
1 - In this blog and the dashboard we use the term 'Access investments' as shorthand to mean investments made by our partners through programmes that Access funds and/ or manages. Where these investments include Access grant, they include co-investment from other sources too. We use the term 'Non-Access investments' to refer to any investments which neither include Access grant nor are part of the Growth Fund programme.
2 - The other two programmes included in the dashboard – Flexible Finance and Local Access (also co funded by Big Society Capital) – were still at a relatively early stage in 2022, so we would expect to see much higher total investment levels in these in next year’s figures.
3 - Mission Critical, State of the Sector Report 2023, SEUK
A few final notes on methodology and data
- We adjusted the Growth Fund data (our largest programme represented on the dashboard) to group each multi-tranche investment into one single investment/ data point.
- In slides 1-3 it is worth noting that if BSC have increased their number of contributors to Deal Level Data over the years (and if new contributors have not all reported their earlier data as well as new investments) then some of the trends in the wider dataset – and therefore how this compares to Access data - may be partially attributable to those changes.
- There are data points that were missing entries for postcode and this meant that we do not have an IMD (Index of Multiple Deprivation) number for all investments. This means that the data on slide 2 is not representative of every single one of our investments. We have omitted these blanks from the analysis, and rather presented the analysis as adding to 100%.